By Joslyn King, Asmaa Mohamed, Mohamed Omer, Max Rosenthal, Alona Sanchez, and Therese Agbetiafa with the staff of the Princeton Summer Journal
Take a walk around Princeton with David Keddie, founder of ‘Walkable Princeton,’ a group dedicated to raising awareness of infrastructure issues, and he might tell you about his experience helping an international student get to and from campus.
“I would drive her to the train station and drive home,” said Keddie. He goes on to explain that she didn’t drive, and there was no accessible transit infrastructure in the area leading to the train. Without Keddie to give her car rides, the only other option would be to walk a long distance every day to and from the train.
This problem is profound for low-income riders, who tend to take more transit trips than their higher-income counterparts. For those people, the bus is a critical part of their lives, but bus systems don’t always meet their needs.
A Princeton Summer Journal investigation into bus systems nationwide compared commute time to several common locations via bus and car. On average, buses in lower-income areas took 15 minutes to travel one mile while wealthier areas traveled at 13 minutes per mile, showing a disparity between a community’s income and bus performance.
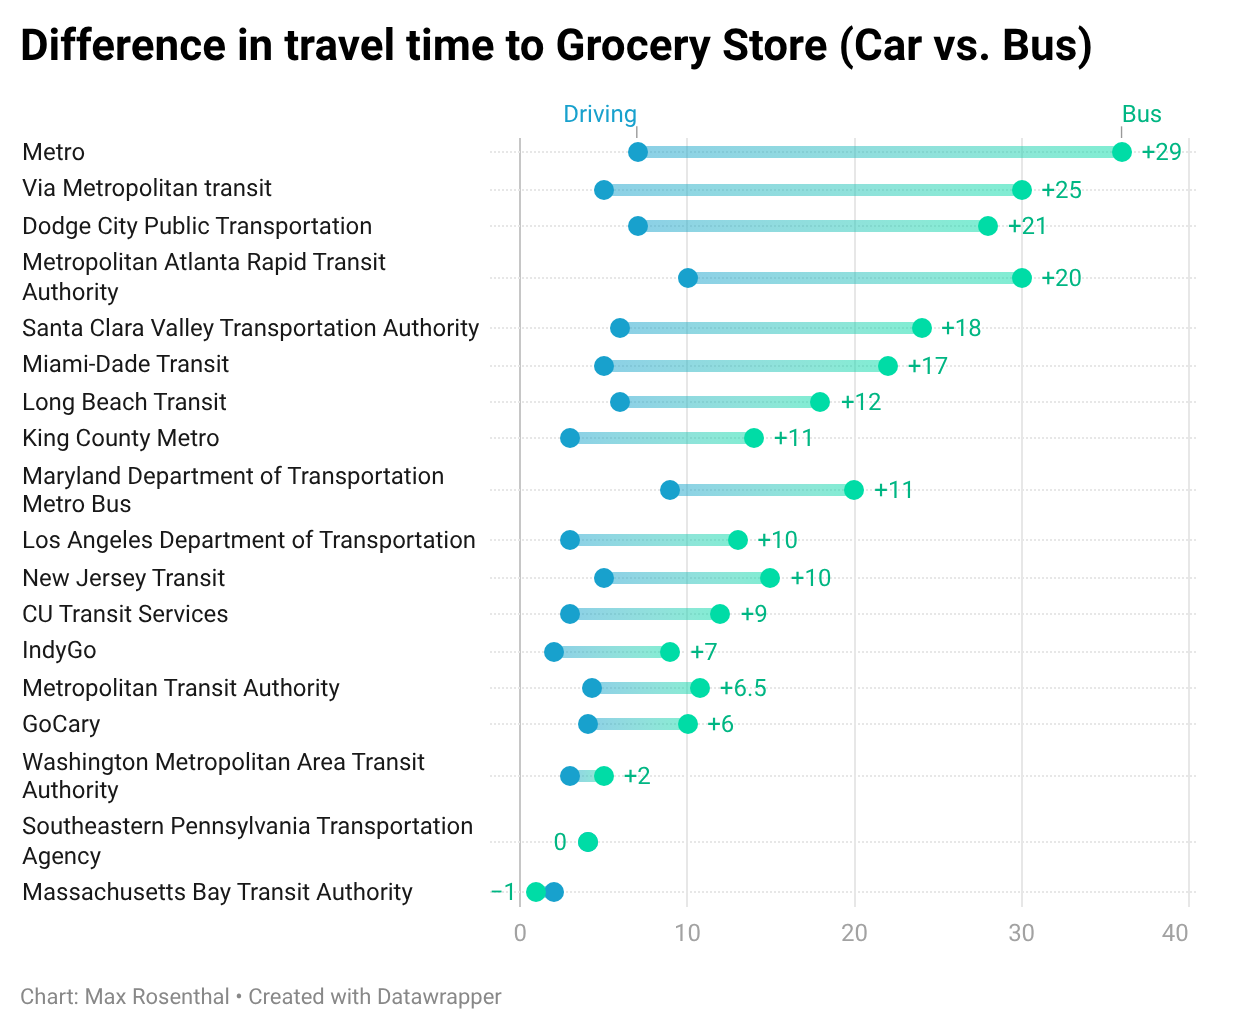
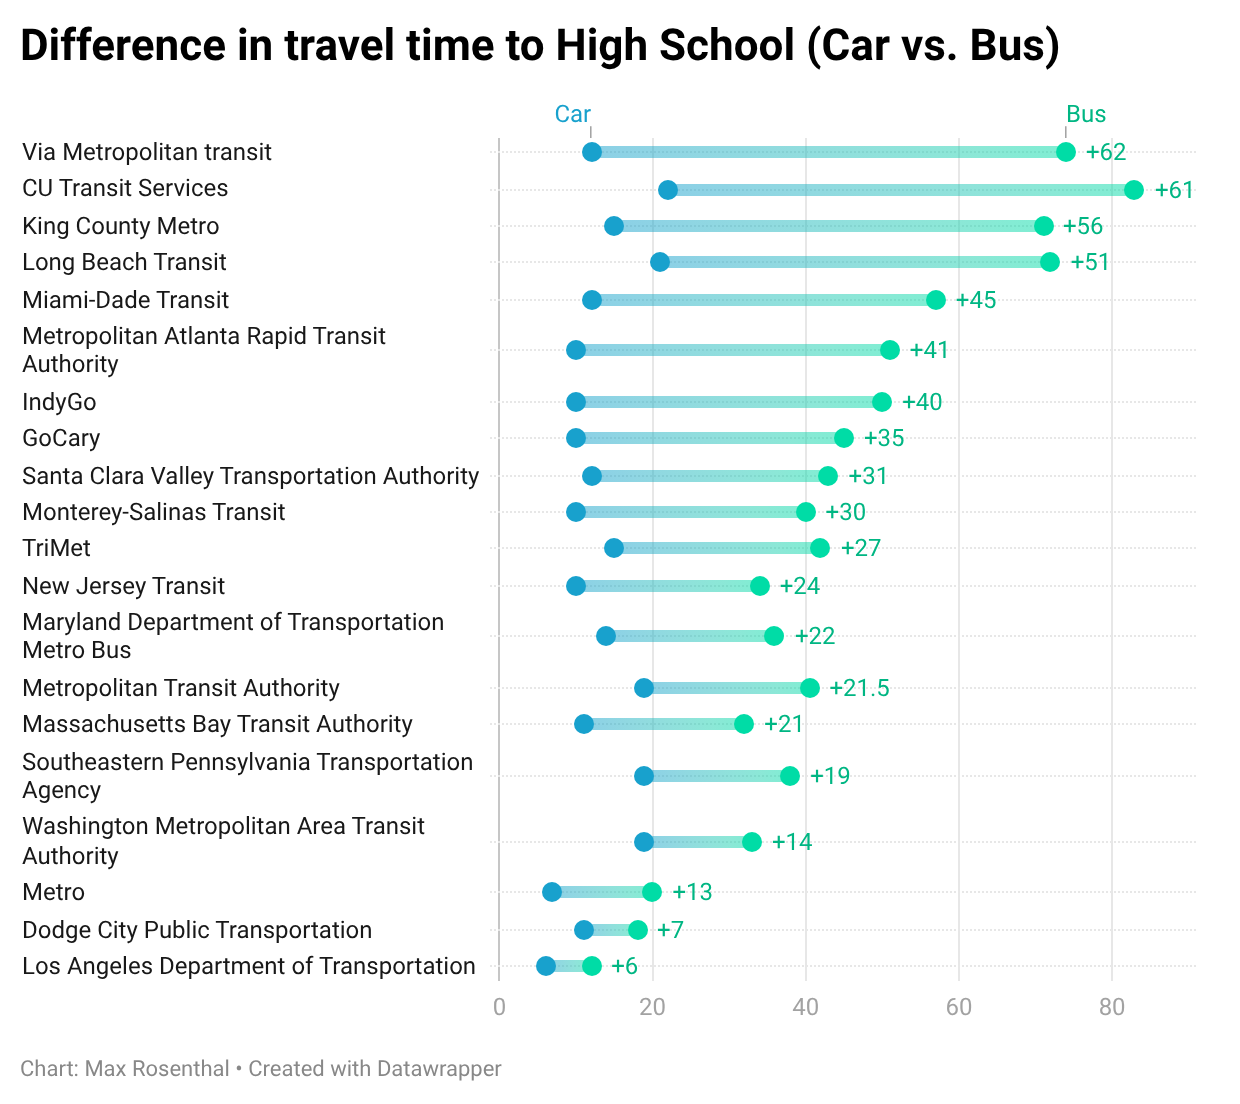
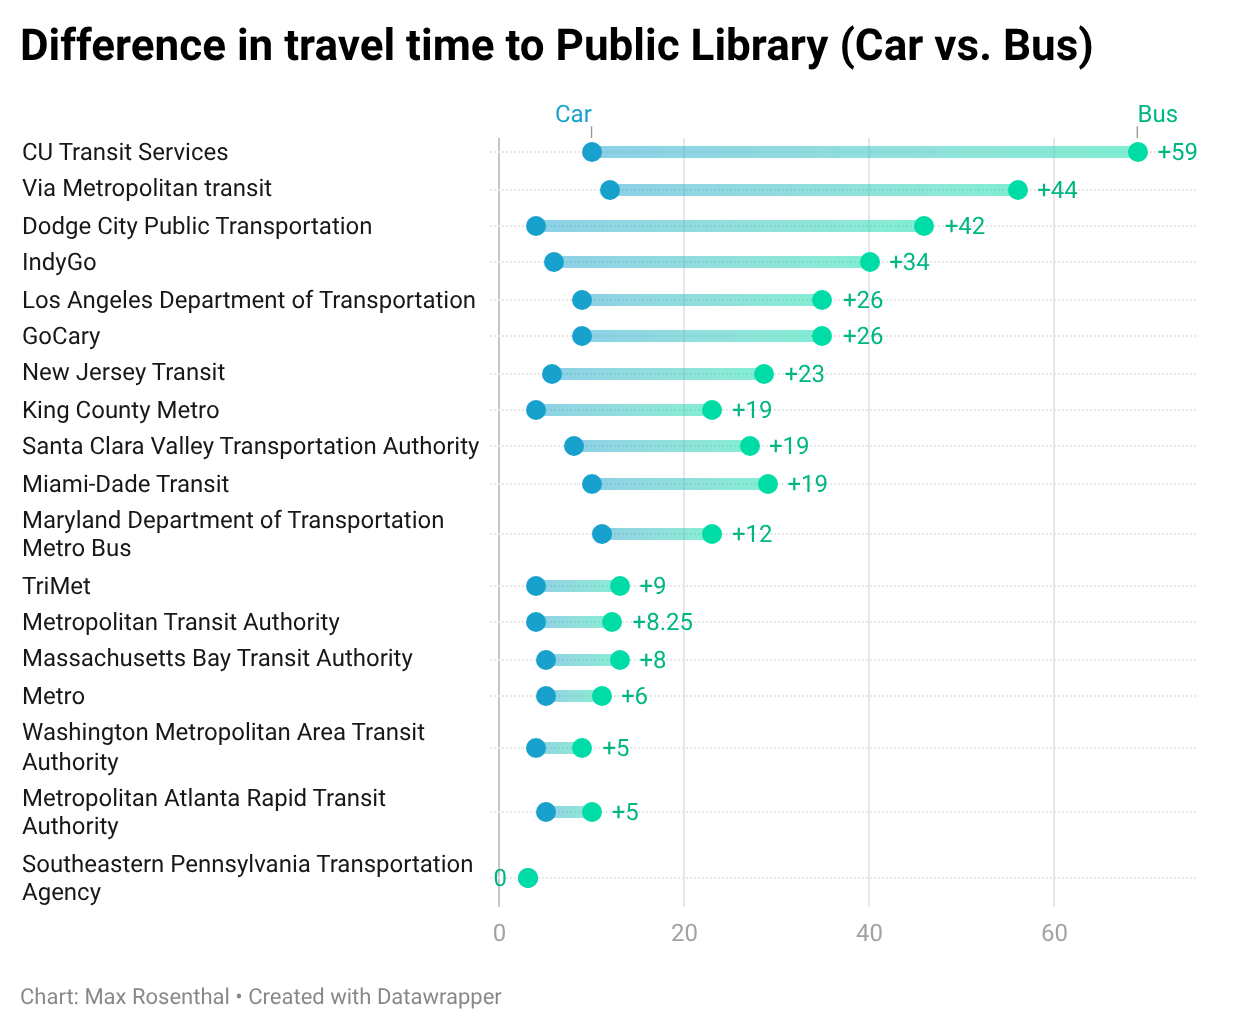
The investigation surveyed the distance from 20 high school students’ homes to their local high school, public library, and grocery store. Students’ high schools were the least accessible by bus—half the bus commutes were at least 30 minutes longer than car commutes. Only four library routes took students at least 30 minutes longer than if they were to drive. Notably, none of the grocery store trips took students at least 30 minutes longer via bus than car. One possible explanation for this is high schools surveyed were farther on average from students’ homes than libraries and grocery stores on average.
Students found that buses were often delayed. In particular, arrival times on Google Maps did not match the actual time buses arrived at the students’ stops. Traffic delays also increased commute times in addition to routine bus delays, even when there were dedicated bus lanes.
Additionally, bus stop accessibility varied. The survey found that around half the bus stops had a bench, and stops without benches typically also lacked a bus shelter. The buses themselves, however, tended to be well equipped; they largely had clean, undamaged seats and working air conditioners.
Ultimately, this investigation demonstrates the complexities of America’s public transit system. Infrastructure, lack of attention from politicians and transit officials, and stigma create a fractured set of options for bus riders. Despite these limits, public transit remains a critical tool to enable people, especially low-income people, to participate in their community.
The issues with public bus systems stem from what transit consultant Jarrett Walker describes as “landscapes that are geometrically hostile to good public transit.”
In small towns, there may not be enough concentrated groups of people or sidewalks to justify having very many bus stops. In cities, it can be the case that there is too much congestion and not enough space on a road for a driver to safely stop when letting people on or off.
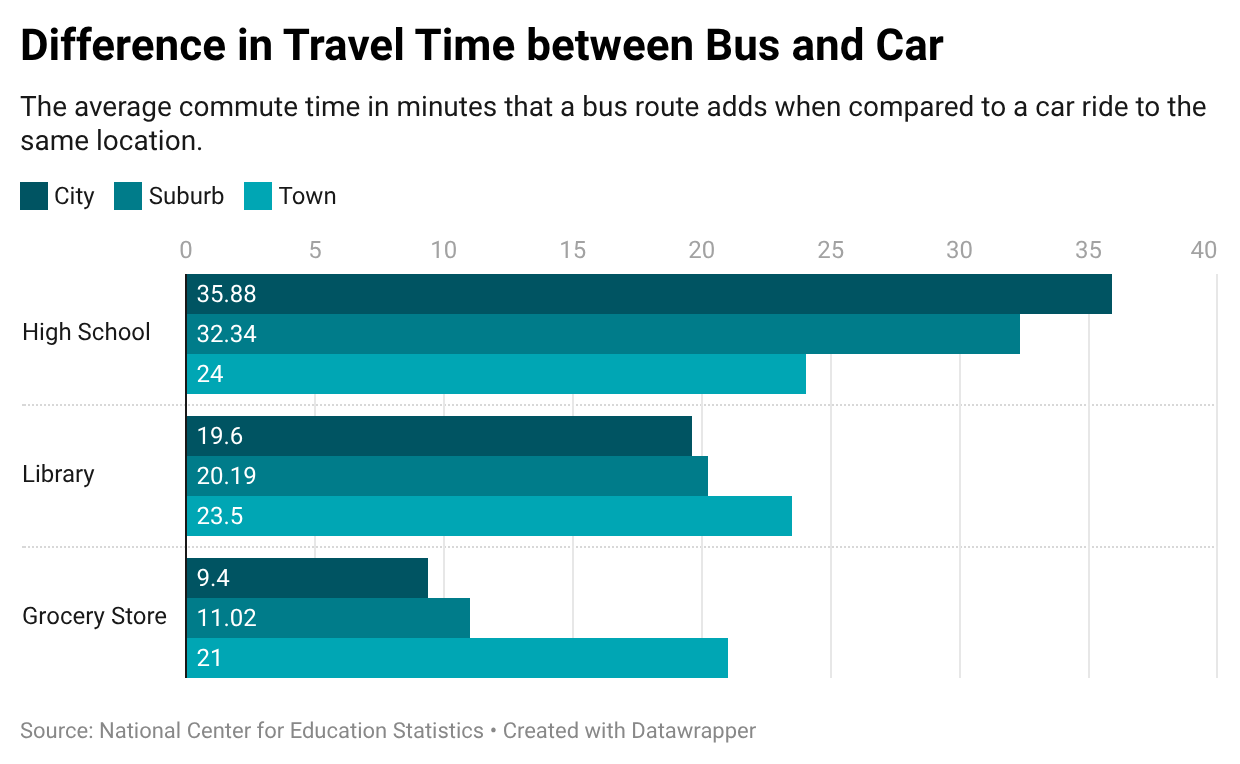
The journal investigation shows significant differences in travel speed between cars and buses in cities, suburbs, and towns. All three geographic locales saw their greatest difference when commuting to high schools, which were the farthest to travel on average at 5 miles away.
When President Dwight D. Eisenhower signed the Federal-Aid Highway Act of 1956, with the intention of overcoming transportation congestion and boosting the economy by promoting quicker transport of goods, it also created an environment that encouraged the use of cars as a main form of transportation. As Walker explained, “Those highways are always going to be accessible from neighborhoods to get them to the center of town, but of course you need to have a car and be car reliant.”
In his work, Walker observed a “low level of understanding among elected decision makers who are actually telling the staff what to do.” Without centering the needs of riders and staff, bus systems risk creating inefficiencies.
Princeton tackled this issue head-on in 2025. “For years we’ve had the Muni bus [municipal free bus] that was old and kept breaking down. So [the Muni bus] was really not something that could help the commercial districts so much,” said Michelle Pirone Lambros, Princeton Council President.
Lambros believed that improved buses and additional distance coverage would benefit residents in the Princeton area. She relied on a community survey of bus riders to inform improvements to the transit system.
“People will say to me, ‘I don’t shop downtown because I can’t find parking space,’” Lambros continued, “It was really more about getting people around that didn’t have transportation, that had accessibility issues, seniors and the other larger piece is young people, who live in multifamily housing that have come recently into our community that need to get around, that may be commuting.”
After conducting the transit survey, and with the assistance of Nelson Nygaard, Lambros helped re-launch the Princeton Loop, an expansion of the city’s fare‑free municipal bus system to include more stops and faster service with an express line.
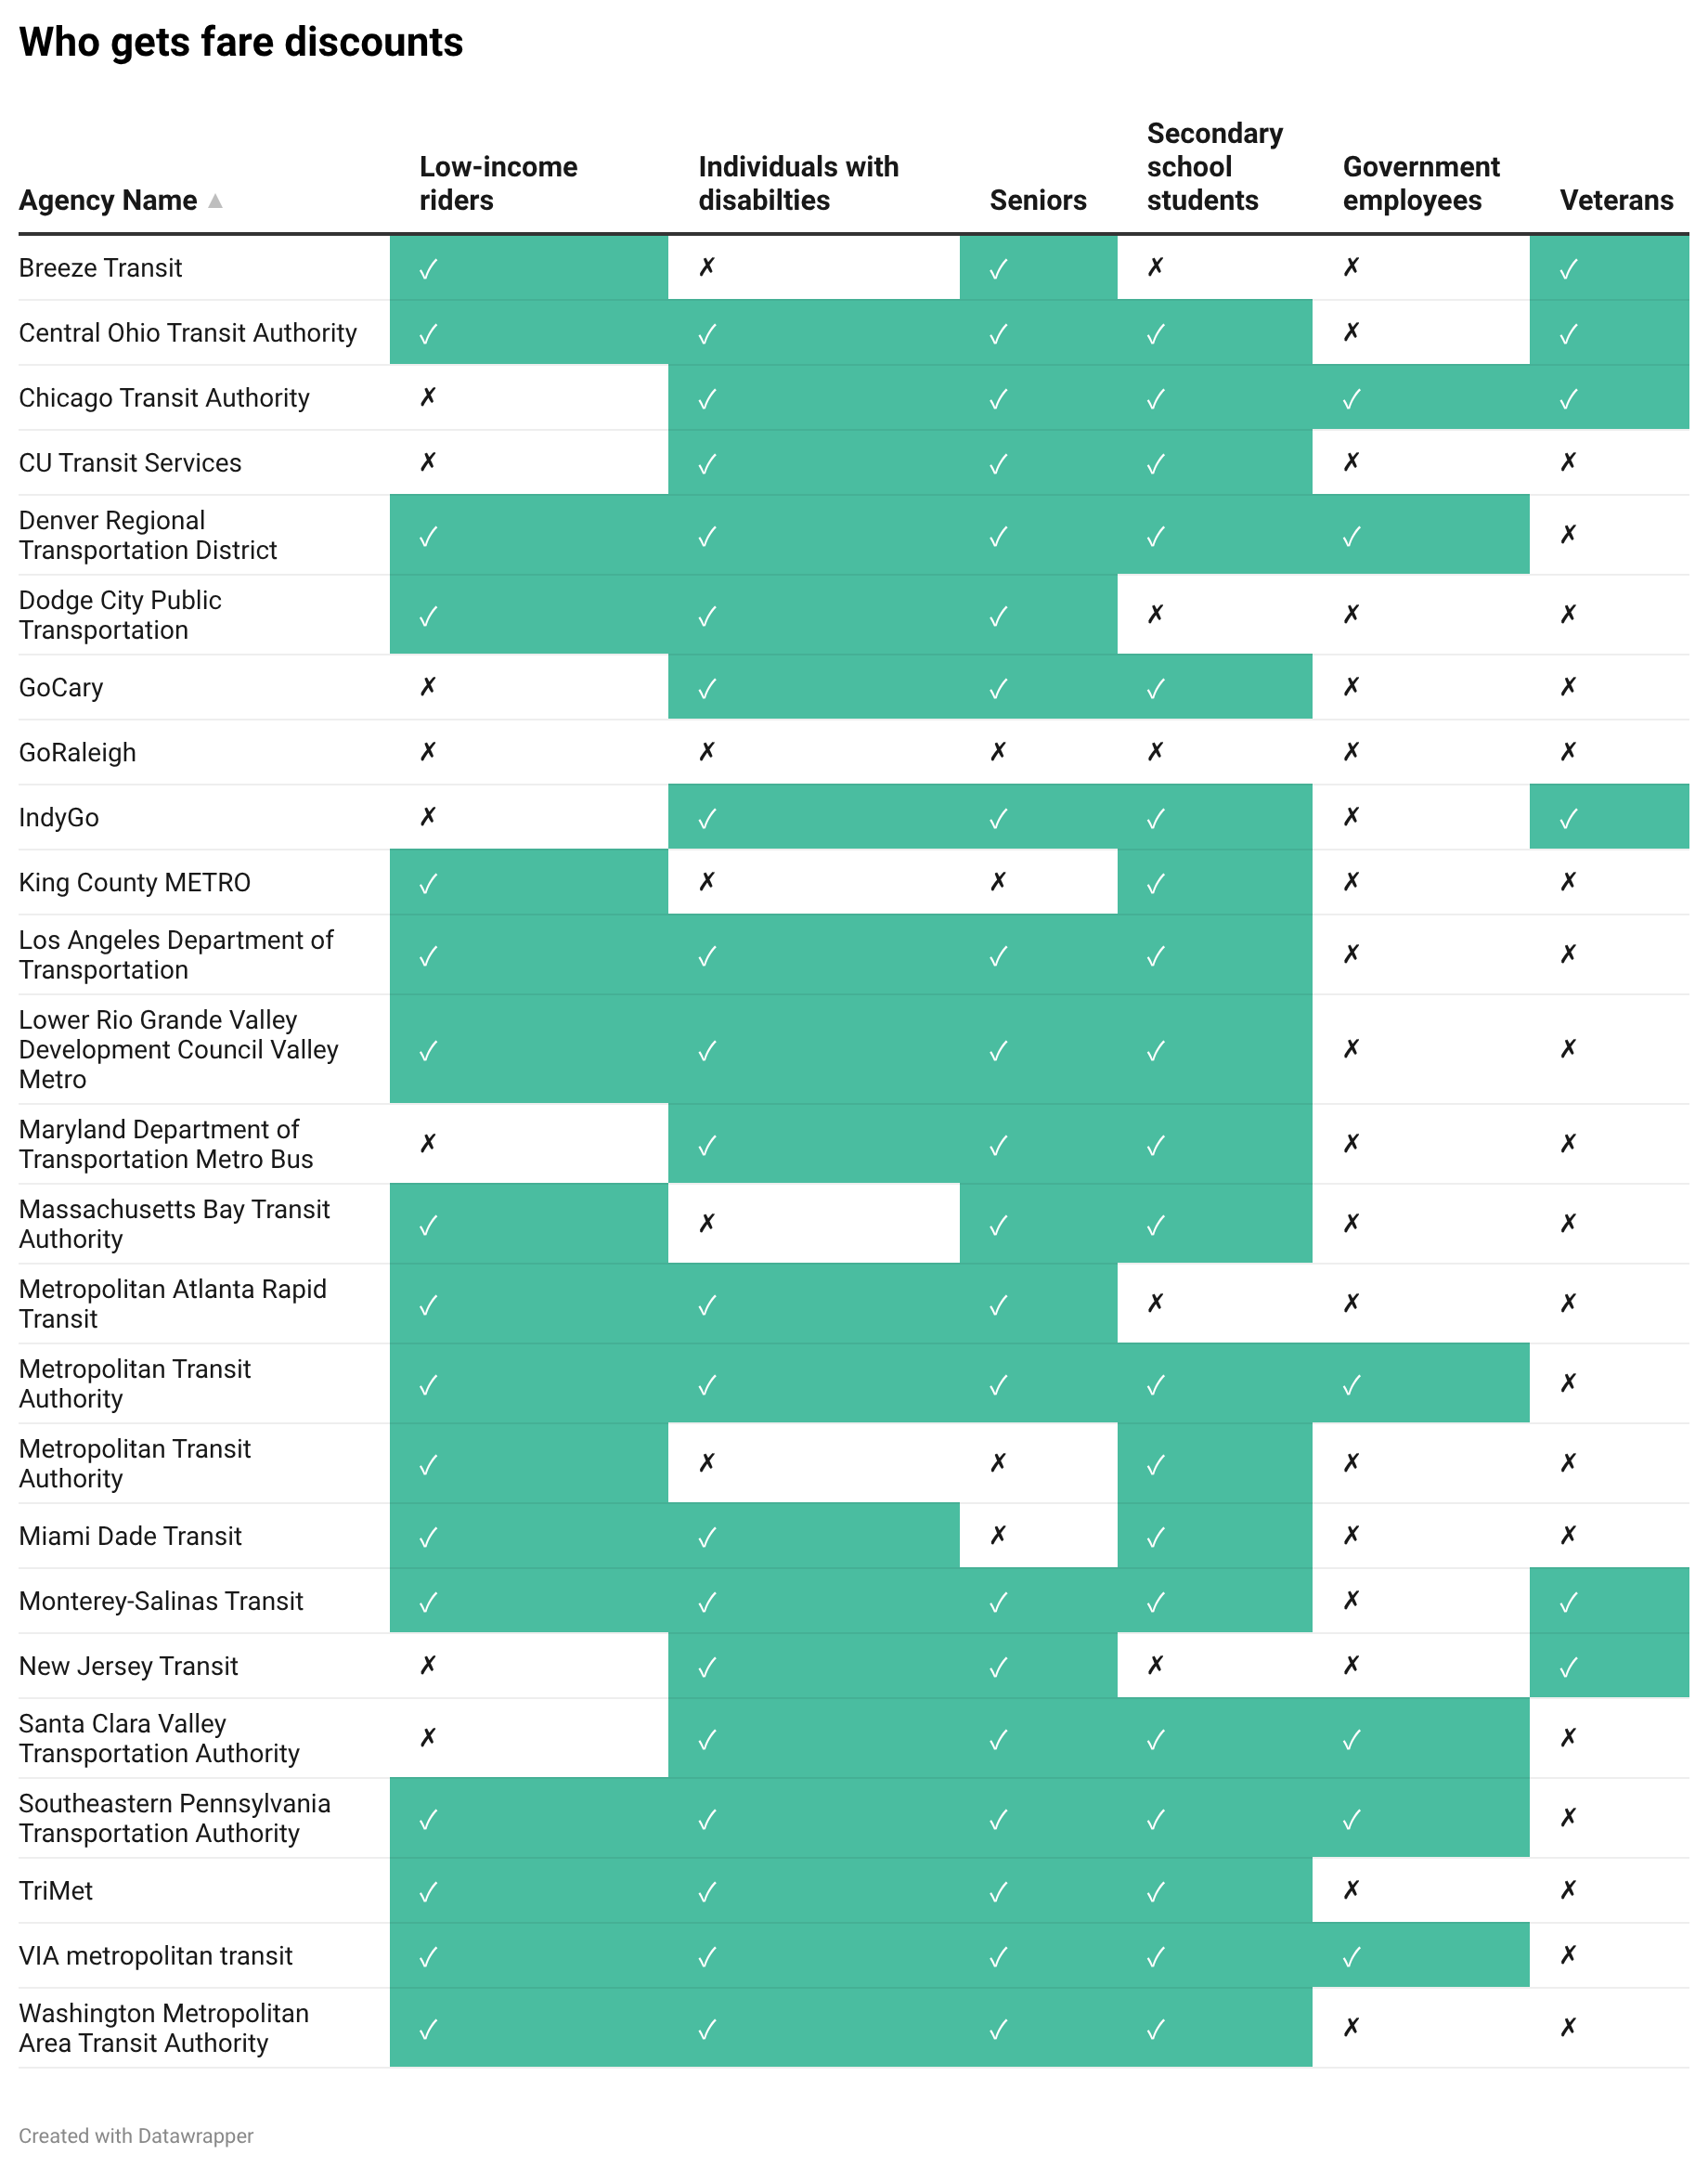
Fare discounts are another way transit systems try to better serve their communities. Every transit system surveyed except one offered a fare discount of some kind. These discounts help encourage more people to ride the bus.
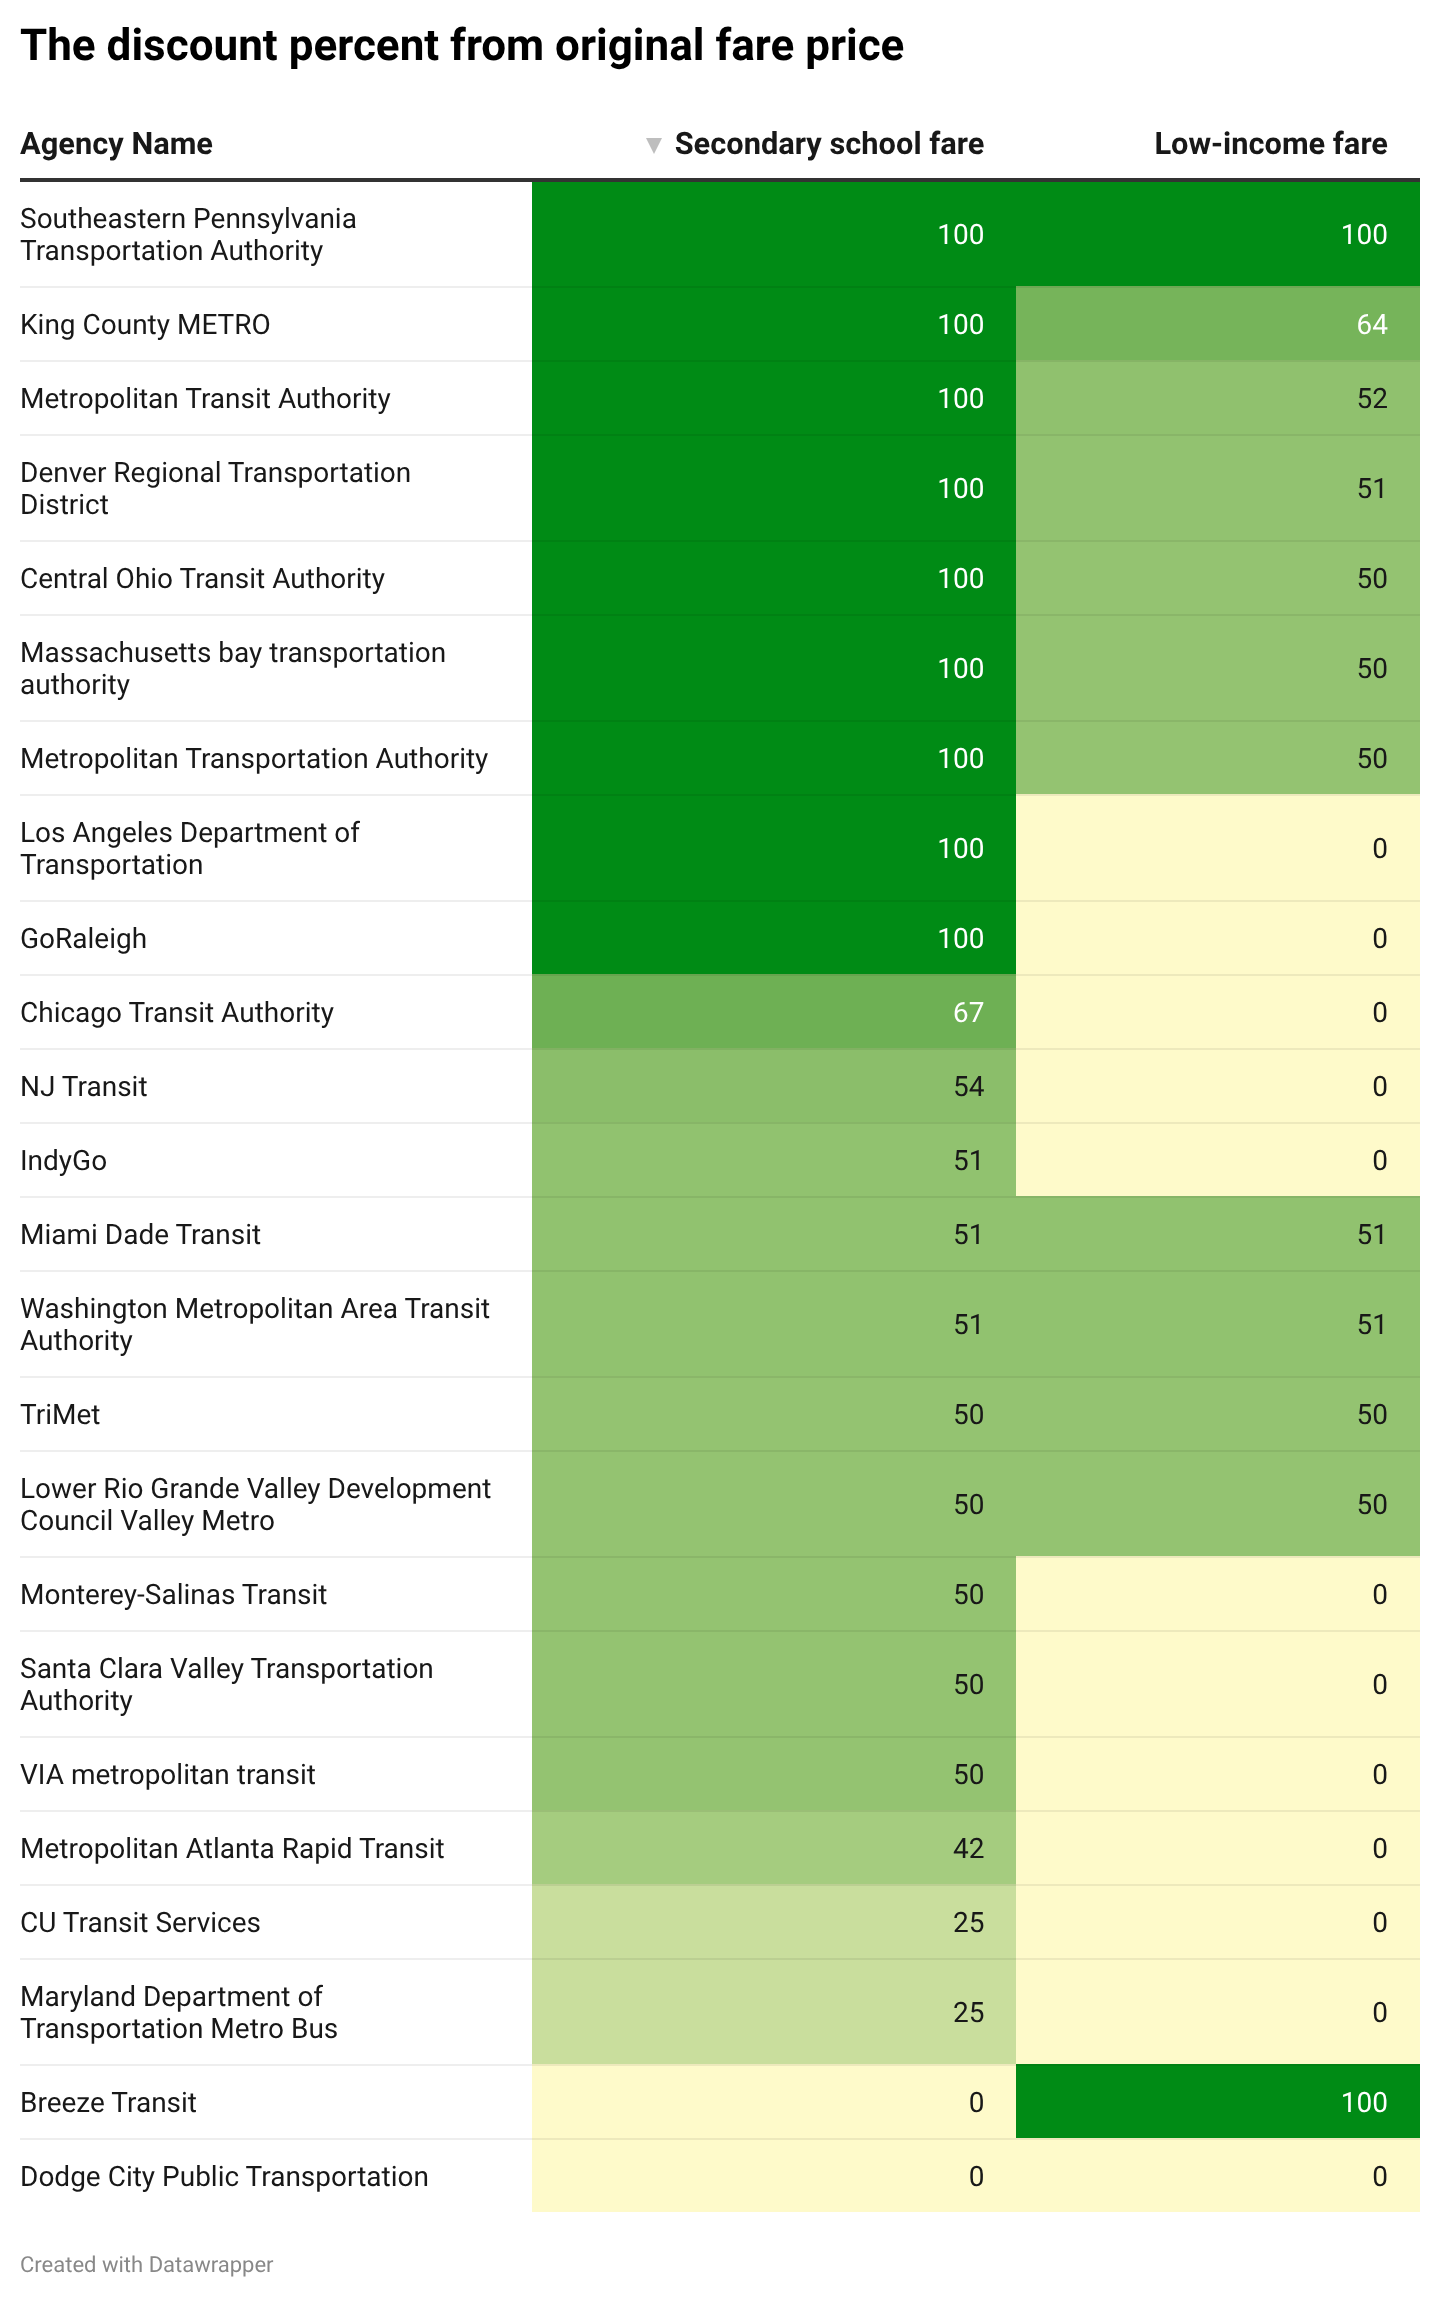
Low-income people, individuals with disabilities, seniors, and high school students have the most discount opportunities in the bus systems surveyed. Student fares in particular are more likely to have larger discounts than low-income fares. This unlocks easier access to education.
Looking forward, Walker suggests cities look to Canada for examples of how to improve transit systems: “We’re doing a wonderful natural experiment in North America, which is that we have two different countries with different political systems in basically the same landscape, with basically the same history of urban development, basically the same age.”
The Toronto Transit Committee, for example, maintains fifty-two routes that operate every 10 minutes or better. This helps ensure that frequent and reliable service is available across the city.
Jonathan English, an urban planner based in Toronto, said in a Vox interview, “Even car owners in Toronto ride the bus. That shows that it is possible that if we invest in basic operations and improving basic local service, that the riders will come”.
When a more diverse group of people use public transportation, it stimulates a culture that cares about the accessibility and comfort of public transportation.
According to the Manhattan Institute, an independent, nonpartisan public policy research organization, “people will take buses and trains only if they feel safe while riding them. Mass transit in the United States lacks mass appeal”.
Even if the infrastructure issues were solved, buses have another problem to overcome: stigma.
“When you are driving your comfortable car down the road, and you see a woman standing in the rain at a bus stop with no bench with two bags of groceries. What do you think you’re seeing?” asked Walker.
“Most people think they’re seeing a loser or a failure. Someone that they can look down on. And to me, as a transit planner, what I’m seeing is a pioneer.”
Our Methods
Both fare price and fare types available per bus system came from the 2025 American Public Transportation Association (APTA) database, and when needed where verified with the transit system’s official website.
To determine which mode of transportation was faster to arrive at a given location, travel times shown on Google Maps for each route were compared. A difference of 30 minutes between the bus and driving routes was defined as one mode of transportation taking substantially longer.
While there was data for 20 bus systems in total, charts only visualized routes where it was possible to take the bus; any car-only routes were dropped.
City, suburb, and town designations were determined by the NCES Locale Lookup. The poverty rate in each location was recorded from Census data and categorized into a low-income area if the rate was above 10.6% —the national poverty rate— and a high-income area if below that threshold.